Novel Synthesis of Bionanomaterials by Conversion of Potato Peels and Adsorption Studies of Ni on Prepared Surface
-
A. Khan
Department of Chemistry, University of Karachi, Karachi-75270, Pakistan
A. Saleem
Department of Chemistry, Jinnah Govt. College, Nazimabad, Karachi
| Received 12 Jan, 2024 |
Accepted 07 Mar, 2024 |
Published 29 Mar, 2024 |
The current research aimed to synthesize bionanomaterial (BNM) using potato peels (PPs) and their application in eliminating the toxic metals from wastewater. For this purpose, an effort has been made to convert PPs at the nanoscale for their use as bio-nanosurfaces, while Ni solution was selected as wastewater for investigation. The potato peels were collected from the fries shop and transported to the Department of Chemistry at the University of Karachi, where they were thoroughly washed, dried, ignited and ground to convert them into finely powdered bio-nanoparticles (BNPs). The fine particles were subjected to FTIR, SEM and EDS. The FTIR spectrum established that COOH and OH functional groups are present in the synthesized BNPs and recognized for being active in the adsorption of Ni (II) ions from solution during sorption studies. SEM analysis confirmed the conversion of PPs into BNP (89.5-94.3 nm), while EDS showed some essential metals like Na, K, Ca and Mg. The kinetics of the metal sorption was investigated at several operational parameters, such as the impact of pH, adsorbent concentration, initial metal (Ni) concentration, and contact time and sorption. It was observed that adsorption was of the pseudo first order. Langmuir and Freundlich's models were applied where the Freundlich model best fitted to sorption studies The BNM particles were collected after sorption studies via filtration, washed, and dried. Subsequently, they experienced SEM, EDS, and FTIR analysis for potential reuse, suggesting their efficacy in efficiently removing the metal ions. It was concluded that the bio-nanomaterial prepared by potato peels could effectively be used as the best future technique for the control of heavy metals; however, further trials are recommended for the application of this venture.
INTRODUCTION
The discharge of heavy metals like Zn, Ni, Fe, Cu, Cr, Pb, As, and Hg, etc, into the water reservoirs through industries has now become problematic worldwide and requires attention to control these toxic metals[1]. A few of these metals, like Cu, Fe, Zn, and Ni, have some role in the biochemical process of living beings[2], but excess concentrations of these are also toxic. Over the last few decades, industries have been discharging their waste products containing heavy metals into open atmospheres[3]. Noxious metal ions present in wastewater or freshwater cause environmental and health issues because these metals are non-biodegradable, persist in nature, and accumulate through the food cycle[4]. Several industries, like plastic manufacturing, metal finishing, tanneries, paint industries, and car radiator manufacturing, discharge wastewater containing heavy metals directly or indirectly into rivers or other water sources without treatment[5]. Freshwater reservoirs are usually used for irrigation purposes, but when they are mixed with industrial wastewater, they become harmful to the cultivation of crops or life present in these water resources[6]. Moreover, heavy metal-contaminated water, when used in irrigation, contaminates crops through accumulation and, ultimately, losses observed in human beings[7].
Several researchers have revealed various techniques for the treatment of wastewater, including ion exchange, chromatography, membrane separation, chemical precipitation, and adsorption. However, for under-developing countries, these costly methods are not affordable[8-10]. The treatment of water requires economically diverse sorbents for wastewater treatment. Peels can play an influential role in this regard. They may act as the best biosorbents and are supposed to be cost-effective due to their low cost and having many effective surfaces for the adsorption of the metal[11-13]. Liu et al.[14] reported that activated carbon proved to be an excellent removal surface for organic and inorganic sources found in an aqueous system. They also reported that the surface area of activated charcoal is about 500 to 1500 m2g-1; because of its surface area, it can be used for water treatment[15-16]. It is effective in removing many reacting species due to the presence of various functional groups[17,18]. Adsorption of metals by prepared surfaces or bio-nano materials obtained from vegetables or fruit peels is the most frequently adopted method because these peels are discarded from many sources on a regular basis and may be utilized as the best removing surface[19-21]. The aims and objectives of the current article are the use of potato peel waste and their conversion at the nanoscale for the adsorption of heavy metal. The investigation includes the collection and conversion of potato peels, followed by their characterization using advanced technologies like FTIR, SEM, EDX, and UV/Visible spectrophotometry. The removal of heavy metals was studied using several parameters, and adsorption isotherms were tried to fit the obtained data.
MATERIALS AND METHOD
All chemicals were purchased from Merck, while potato peels were collected from fries shops of the University of Karachi and transported to the Department of Chemistry, University of Karachi, where they were preserved after washing, drying at 110oC for 3 hours and grinding to obtain fine surface, then were placed in a furnace for 120 min at 600 oC and placed in a desiccator for their use. The characterization of the ignited surface was conducted using FTIR, SEM, and EDS analysis for the functional group of the surface, size of the nanomaterial, and EDS for elemental composition, respectively[19,20].
Preparation of stock metal solution and working standards
The required amount of the NiSO4.6H2O was dissolved in distilled water to prepare 1000ml of stock solution of 1000ppm, which were diluted as 50ppm, 100ppm, 150ppm, 200ppm, and 250ppm at the time of the experiment. The standard calibration curve and linear regression methods were used to investigate metal ion concentration[5]. The basic principle used is Beer's law, which co-relates absorbance and concentration.
Beer's Law: A = Є b C
Where A= Absorbance, Є= Molar absorptivity, b= cell path length, and C=Concentration
FTIR Analysis of BNM
The FTIR analysis of BNM was conducted on Shimadzu IR Prestige-21 Instrument (10,000 to 100 cm-1) using KBr before and after adsorption, which is the most traditional method for the study of the samples. Incident infrared light passes through the sample, converted into rotational and vibrational energy by the sample molecules, and the amount that transmits through is measured, producing an FTIR spectrum in the % transmission spectrum. The resulting signal at the detector presents as a spectrum, typically from 4000 cm-1to 400 cm-1, representing a molecular fingerprint of the sample[21].
SEM and EDS analyses of the BNM
The physical size of the as-prepared BNM was conducted through scanning electron microscopy (SEM), which is a comparatively speedy, low-cost, and mostly nondestructive method ofsurface analysis and allows both the morphology andcompositionof materials in the current era of Science and Technology. The BNM was placed under an SEM instrument, and the signals used by SEM to produce an image resulted from the interactions of the electron beam with atoms at various depths within the sample. The elemental analysis of the BNM was conducted through EDS detector employed for measuring the energy of the emitted photons in the X-ray electromagnetic spectrum. A solid-state chip or crystal detector was cooled to superconducting temperature for high quantum efficiency and is off-axis from the incident beam.
The detected X-rays are segregated into energy channels based on their interaction with the detector and form a spectrum of detected energies. The peak energies and electron transition determine the element present in the spectrum[22].
Adsorption studies
A batch experiment was conducted where different doses of surface (prepared bionanomaterial, solution of heavy metals, and contact time were determined at various pH to optimize the sorption processes at room temperature. The pH of the reaction mixture was adjusted using acid and base (H2SO4 & NaOH) with a concentration of 50 ppm by taking 0.5g of potato peel nanomaterial at 25 oC. The samples were agitated for 60 minutes to reach equilibrium. The effect of adsorbent (BNPs) concentration was investigated by shaking a series of known concentrations of Ni(II) ion solutions with BNM weight ranging from 0.20-1.00g at constant agitation speed for 1 hour. The solutions were then filtered with the help of filter paper to separate BNM, and the remaining metal was analyzed by measuring the absorbance of the solution using a spectrophotometer. The effects of the initial concentration of metal were investigated by agitating 0.20 -1.0g of BNM with 50 mL of Ni(II)ion solution ranging from 50-250ppm at constant agitation speed for 1 hour, followed by filtration and absorbance recorded by a spectrophotometer. The effect of agitation time was investigated by agitating 0.20g, 0.40g, 0.60,0.8g and 1.0g of BNM with 50ppm metal solution for 5, 10, 15, 20, 25, 30, and 60 minutes, filtered and optical density recorded.
Adsorption capacity
The adsorption capacity of prepared BNM was determined with a known amount of adsorbent (0.2-1.0g) with 50 metal solutions of known concentration (50ppm–250ppm) in a 100 ml beaker, shaken with a magnetic stirrer at 100rpm for 60 minutes at room temperature. After filtration, spectrophotometric analysis was performed to calculate the % removal using the following formula (Eqn.1).
| (1) |
Co = Initial concentration, and Ci= Equilibrium Concentration
After equilibrium, the adsorption capacity qe(mg/g) was determined using the following equation(2)
| (2) |
Co and Ce =initial and concentration before and after adsorption, respectively, V = Volume of the solution(L) and W = Weight of BNM (g). The removal of Ni was determined by a standard calibration curve of the Ni(SO4) to determine the remaining concentration.
RESULTS AND DISCUSSION
The characterization of bionanomaterial (BNM) showed that it converted into the nano surface, and their application in the extraction of heavy ions like Ni(II) from wastewater revealed that BNM synthesized by potato peels was effective in eliminating the metal from wastewater. The kinetics was investigated at several operational parameters, such as temperature, pH, and solid-liquid ratios. The equilibrium data at various temperatures were investigated using Langmuir and Freundlich isotherms.
FTIR Spectra of bionanomaterial(BNM)
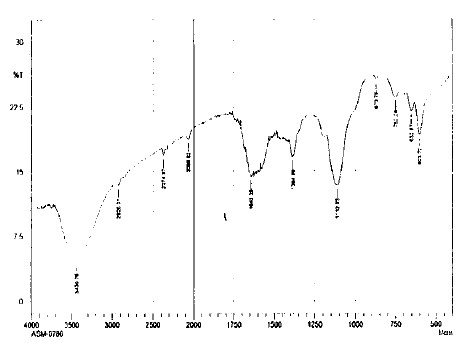
The FTIR spectroscopy of the BNM exposed that the potato peel surface consists of different groups that are involved in the adsorption of metal from wastewater. The peaks of the various functional groups that appeared in the IR spectrum verified the literature and described the role of the surface in recovering the wastewater[25-30]. The FTIR spectrum of the BNM before adsorption is shown in Fig. 1. The broad and intense peak at 3439 cm-1 was ascribed to the stretching of the O-H group due to inter-and intra-molecular hydrogen bonding of alcohols or phenols, carbohydrates, and cellulose which are polymeric compounds present in potato peels. The peak observed at 2926 cm-1 was related to the stretching vibrations of the C-H bond. The other peaks between 1600cm-1 and 1300cm-1 are due to different functional groups, which may correspond to carbon, silica, Sulphur, and phosphorous bonds with different atoms such as oxygen, hydrogen, or carbon. These peaks appear in all spectra having the same characteristics. The peak observed at 1643 cm-1 is believed to be the reason for the CO bond of the carboxylic acid or its ester. The strong peak that appears at 1645 cm-1 represents the stretching vibration of the carboxylic acid CO that exists in the intermolecular hydrogen bond[21]. The different stretching peaks of OH and COOH in the bionanomaterial may be responsible for metallic ions bonding with the BNP (Fig. 1). The peak at 1375 cm-1 appears in OH bending vibrations, –C–O–H in-plane bending, and the peak at 1112.03 cm-1 is C–O stretching vibrations while 780 cm-1 is = C–H out-of-plane bending. The FTIR spectrum analysis after adsorption showed some new characteristic peaks at 1741.72 that did not appear in BNP before adsorption (C=O stretching vibrations –COOR groups). The peaks appeared at 1562.34 C–O vibrations (e.g. in the –COOR groups of crocetin)/amide II /aromatic –C=C stretching vibrations). 1456.16 C–H bending (scissoring) (in CH3 groups) /aromatic –C=C stretching vibrations.1321.2 cm-1 C(O)–O stretching vibrations and –OH in-plane vibrations/amide III (e.g. i1043 C–4–OH)[21]. After desorption, the FTIR spectrum showed 1564 cm-1 and 1031 cm-1 (C-4-OH) (Fig. 3)[22].
|

|

|
Scanning Electron Microscopy SEM of prepared BNM
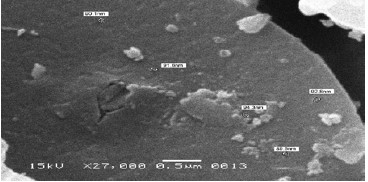
The surface characterization of prepared BNM was conducted through scanning electron microscopy (SEM), which provides a prosperity of evidence to elucidate their adsorptive potential (Fig. 4).
|
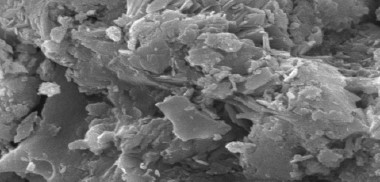
The size of BNM was in the range of 89.5nm to 92nm (Fig.4). The absorptive potential of the BNM was investigated in three phases viz; i) before adsorption, ii) with adsorption of Ni metals and, iii) after adsorption, while representative SEM is shown in Fig. (4-6). The SEM images showed accelerating changes in the BNP on adsorbing and desorbing of Ni(II) ions (Fig. 6 &7). SEM image before adsorption (Fig. 4) showed a porous surface where metal could adsorb while Fig. (5) represents the adsorption of Ni on BNP i-e Ni (II) physically adsorbed corroborative that surface is porous. The SEM also shows the adsorbed metal does not fully occupy the BNP surface and has more capacity to adsorb the metal ions on it. The BNM was recovered when agitated with EDTA, where Ni is removed by forming a Ni- EDTA complex (Fig. 6). The SEM analysis after desorption of metal from the surface showed active sides of BNM are again available for metal ions adsorption and established that BNM may be reused several times (Fig.7) validating that it is a cost-effective technology where metal is adsorbed and recovered in the form of Ni-EDTA complex by the chelating agent EDTA from wastewater[19].
|

|
Energy Dispersive X-ray (EDX) Spectroscopy of Surface
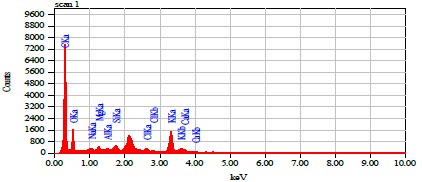
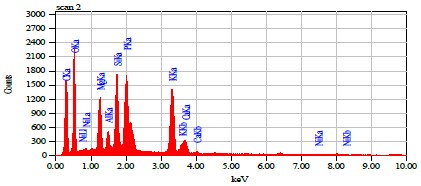
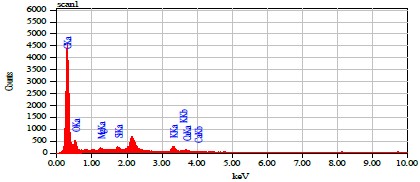
The EDS of the BNM[Fig.7] showed that carbon and oxygen are the primary constituents, with some other elements such as Calcium, Silicon, Sodium, Aluminum, Magnesium, Potassium, and Chlorine also found in minor amounts, according to the previous reports[23-26] where they reported all elements in BNM. EDS result showed that all the constituents present in potato peel were also present in the prepared surface. The EDS result of the prepared BNM showed that a large quantity of K ions was present before sorption and remained slight in quantity after Ni (II) adsorption on the prepared surface. These released ions may also be responsible for the pH of the aqueous system. EDS result shows the actual Ni (II) ions sorption on the prepared BNM as the metals absorbed on the surface have a substantial percentage of Ni (II) ions (Fig.8), which was not present before adsorption (Fig.7) and after sorption (Fig.9), which is evidence for the usefulness of the prepared bio-nanomaterial for extracting Ni (II) ions from wastewater.
|
|
|
Effect of pH
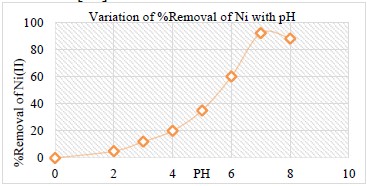
A batch experiment was conducted to validate the adsorptive potential of BNM under varying pH. Standard Stock solutions of Nickel sulphate hexahydrate (NiSO4· 6H2O) were used in double distilled water by adding the required amount in 1000ml water, followed by the preparation of the standard solutions of the required concentrations in double distilled water at the time of the experiment while 0.1 M HCL and 0.1 M NaOH were used accordingly to adjust the pH. Initially, as the pH increased from 3 to 7, the biosorption capacity was increased from 10 to 92% for Ni(II) (Fig. 10). It was observed that no precipitation was observed in acidic pH as compared to alkaline. The current results are in accordance with the findings of El-Ashtoukhy et al.[15], who reported the optimum values of pH for the removal of Cu and Pb in the range of 5-6 on pomegranate peels. In contrast, Garba et al.[30] report the optimum pH as 4.36 for the sorption of Cd and Ni using plantain peel. The maximum absorption for Cr, Cd, and Co was found at pH 5 on activated carbon, obtained by orange peels[31], but pH for Pb and As was in the range of 2 and 4 on the soya-been surface[32].
|
Effect of Adsorbent Dosage
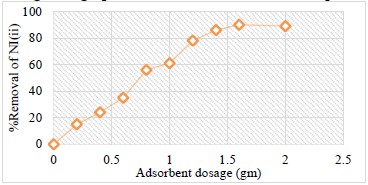
The effect of dosage in adsorption studies is a significant parameter which was tested by varying amounts of the BNM ranging from 0.2 to 2.0 gm to check the adsorptive potential for Ni(II) sorption. It was observed that the elevated amount directly related to the available surface area, due to which metal removal increased from 40% to 90% at 2gm of BNM (Fig. 11), which was according to the previous reports of Ali and Sattar[25], who reported the 2gm dosage of orange peel for the extraction of some heavy metal while for Ni and Cd 0.82 gm on modified plantain peels[31]. In comparison, a dosage between 0.02g and 0.05g of activated carbon obtained by using orange peels showed maximum adsorption for heavy metals Cr, Cd, and Co[32].
|
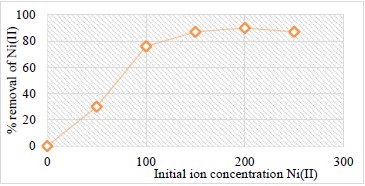
Effect of initial concentration of Ni
The effect of initial Ni (II) concentration was studied on the percent (%) removal using BNM viz, 50ppm, 100ppm, 150ppm, 200ppm, and 250ppm. Generally, the sorption capacity increases with the amount of BNM. Results showed the % removal related to the initial concentration of the Ni(II) that when the concentration of metal was low, the adsorption was high, but when the concentration of metal in wastewater increased, the % removal decreased, indicating the sorption capacity related to the amount of adsorbent which in turns related to the surface area. The maximum % removal for Ni(II) in an aqueous solution was at 200ppm at desired pH 7 at a contact time of 60 minutes when BNM was 2gm (Fig. 12). The adsorption attribute suggests that saturation of the BNM surface is reliant on the initial metal ion concentration. At low concentrations, the available metal was taken up more quickly at the adsorption sites. At higher concentrations, however, the surface gets fully occupied; therefore, adsorption capacity decreases[34].
|
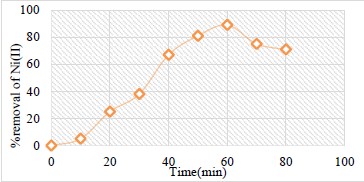
Effect of Contact Time
The effect of contact time on % removal of Ni (II) was studied using time intervals from 10 minutes to 80 minutes. Results established that as contact time increases, the adsorption increases and is found to be a maximum between 40 to 60 minutes (Fig. 13). It may be related to the presence of different functional groups in the BNM in which metal is adsorbed due to the occurrence of groups like OH-. Initially, adsorption increased rapidly, while optimal removal efficacy was achieved in about 60 minutes. After 60 minutes, no adsorption was observed due to the electrostatic hindrance of already adsorbed ions, or the contact time increment showed no significant change in equilibrium concentration, reflecting the adsorption has reached equilibrium as reported earlier by Desta[35]. The current research on potato peel nanomaterial showed a better time of maximum adsorption in comparison to the work of Karimi Darvanjooghi et al.[36], where the maximum time of adsorption for the elimination of Pb from wastewater using eggplant peels was 110 min. In contrast, Schwantes et al.[37] used cassava roots that were chemically modified for Cd, Pb, and Cr removal, where adsorption reaches the maximum value in 40 min.
|
Adsorption Isotherm
Studies on adsorption describe the interaction of adsorbate with an adsorbent and how a balance prevails between residual metal ions in solution and adsorbed metal ions during adsorption on the surface, as reported by Liang et al.[30]. The two primary models, Langmuir and Freundlich isotherms, were applied to predict the capacity of adsorption of a Ni metal on BNM.
Langmuir isotherm
Langmuir adsorption isotherm (Eqn.3) predicts monolayer adsorption with no interaction between the molecules on diverse sites and single molecules adsorbed on the available surface[35]. It examines the linear adsorption occurring at low sorption levels for a single layer, accomplishing maximum surface exposure as metal rises.
| (3) |
Where,
| qe | = | amount adsorbed at equilibrium (mg/g) | |
| Ce | = | the equilibrium concentration of metal ions in solution (mg/L). | |
| θ indicates | = | the fraction of the adsorbent surface covered by adsorbate |
The parameters remaining are different isotherm constants that can be ruled out by experimental data regression. The Langmuir equation (mg / g) measures the capacity of adsorption under experimental conditions, where b is constant and associated with the adsorption energy. The model parameters were estimated with correlation coefficient (R2) for different models, as shown in Table (1). The R2 values are regarded as a measure of the suitability of experimental data on the isotherm's model. Results showed (Fig.14) that the equilibrium was established between the adsorbate and adsorbent system. The main characteristic of the Langmuir isotherm can be expressed in terms of the dimensionless separation parameter Rl (Eqn.4), which indicates the shape of the isotherm that predicts whether the adsorption system is positive or negative.
RL is defined as:
| (4) |
Where b is the Langmuir constant[15],

|
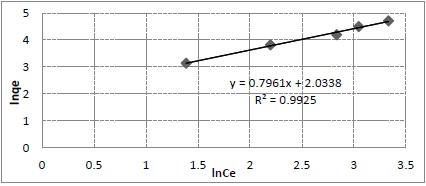
Freundlich isotherm
The Freundlich isotherm was also studied through a mathematical relationship between the amount of metal adsorbed on a synthesized surface and metal concentration to explain the phenomenon observed clearly (Fig.15). Herbert Freundlich proposed an equation for the isothermal variation of adsorption, which is given below (Eqn. 5).
| (5) |
Where qe = amount of Ni (II) adsorbed per unit weight of the adsorbent mgg-1, Ce = equilibrium concentration (mgL-1), Kf = a measure of adsorption, 1/n = adsorption intensity
|
| Table 1: | The values of Langmuir and Freundlich isotherm Constants | |||
| Metal | Langmuir |
Freundlich |
||||
Qmax mg/g |
b(1/mg) |
R2 |
KF |
N |
R2 |
|
| Ni | 303 |
0.0193 |
0.79 |
22.26 |
1.347 |
0.9819 |
| Reported Ni values | 2.702 |
0.037 |
0.373 |
3.907 |
1.18 |
0.67 |
Adsorption kinetics
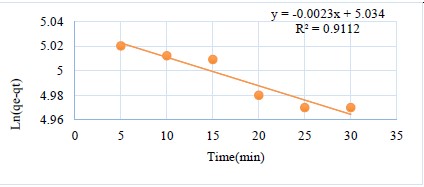
Studying the kinetics of adsorption in metallic wastewater is vital because it provides essential information on the adsorption reaction mechanisms and reaction pathways and also determines the metal absorption rate; consequently, the residence time of the adhesion rate of the sorbate is controlled, which in turn controls the sorbate absorption residence time by the end of the solid solution. To analyse the adsorption kinetics of heavy metal ions, we applied the so-called first and so-called second-order models to the data. The first-order Lagergren ratio equation (Eqn.6) is one of the most commonly used for the absorption of a solute from a liquid solution and is presented as:
| (6) |
Where qe is the metal adsorbed mass at equilibrium (mg / g), qt is the metal adsorbed mass at time t (mg / g), K1 is the first-order reaction rate constant (1 / mg) (Table 2). The pseudo-first-order assumes that the rate of occupancy of the adsorption sites is proportional to the number of sites unoccupied. A straight line ln (qe-qt) vs. t shows (Fig.16) that the first-order kinetic model is best fitted[35].
| Table 2: | Fitted Pseudo-first order Constants for Ni(II) removal on BNM | |||
| Adsorbent | R2 |
k1 min-1 |
qe mg/g |
| 0.5g | 0.9112 |
0.0023 |
153.248 |
|
Additionally, based on adsorption equilibrium, a pseudo-second-order equation for capacity can be expressed as in Eqn.(7):
| (7) |
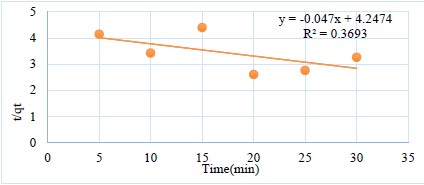
When K2 is quadratic reaction rate equilibrium constant (g / mg.min), the graph of the dependence of t / qt on t provides a linear dependence for the quadratic kinetics applicability (Table 3). The most appropriate model was chosen according to the linear regression correlation coefficient (R2), which measures how well the values predicted by the prediction model fit the data from the experiment. The value of R2(0.3693)(Fig.17) showed that the kinetics of the adsorption studies are best fitted for first-order kinetics instead of second-order kinetics models.
| Table 3: | Fitted Pseudo-second order Constants of for Ni(II) removal on BNM | |||
| Adsorbent | R2 |
k2 mg/g.min |
qe mg/g |
| 0.5g | 0.3693 |
0.1319 |
69.92 |
|
The data from kinetic studies suggest a pseudo-first-order model for Ni(II) that sounds soundly fitted to the Freundlich isotherm. The value of n=1.347 for Ni(II) specifies that the adsorption efficacy is advanced. Hence, BNM synthesized from potato peel proved to be an enhanced sorbent surface that is promising for the removal of heavy metals from water and wastewater.
CONCLUSION
It was concluded from the investigation that BNP synthesized from potato peels acts as a cost-effective surface in recovering wastewater. Analysis of the surface through FTIR results shows the functional groups of COOH and OH that are mainly responsible for the absorption of metal ions, while EDX displays some essential cations such as Ca, K, Mg, and K, which were helpful for the maintenance of pH (neutral pH 7) of the aqueous phase that favoured Ni(II) ions adsorption. The potency of prepared bio-nanomaterial for the extraction of heavy metal from wastewater was reliant on different constraints like pH, initial concentration of metals, and contact time. The maximum extraction of Ni(II) was obtained at pH 7. As the dosage increased, the equilibrium was established. The adsorption studies established the first-order kinetics and the best fit to the Freundlich adsorption isotherm models.
ACKNOWLEDGMENT
The author is thankful to the Department of Chemistry, University of Karachi, and the Dean Faculty of Science, University of Karachi for providing the research facilities.
REFERENCES
- M. A. Chavan, & S. Mane, Int. J. Sci. Res.(IJSR), 4, 3076-3080 (2015).
- T. M. Ansari, N. Ikram, Najam-ul-Haq Najam-ul-Haq, I. Fayyaz, Q. Fayyaz, I. Ghafoor, and N. Khalid, 95-99 (2004).
- S. T. Sankpal, & P. V. Naikwade, Science research reporter, 2(1), 88-90 (2012).
- O. E. Odipe, M. O. Raimi, & F. Suleiman, Madridge J Agric Environ Sci, 1(1), 1-6. (2018).
- P. U. Singare, A. G. Jagtap, & R. S. Lokhande, International Journal of Global Environmental Issues, 11(1), 28-36. (2011).
- M. Mokarram, A. Saber, & V. Sheykhi, J. Cleaner Prod., 277, 123380. (2020).
- S. Chaoua, S. Boussaa, A. El Gharmali, & A. Boumezzough, J. Saudi Soc. Agric. Sci., 18(4), 429-436. (2019).
- S. K. Gunatilake, Methods, 1(1), 14. (2015).
- Renu, M. Agarwal, & K. Singh, Interdisciplinary Environmental Review, 18(2), 124-142. (2017).
- N. A. Qasem, R. H. Mohammed, & D. U. Lawal, Npj Clean Water, 4(1), 36. (2021).
- T. Aman, A. A. Kazi, M. U. Sabri, & Q. Bano, Colloids Surf., B, 63(1), 116-121. (2008).
- J. Anwar, U. Shafique, M. Salman, A. Dar, & S. Anwar, Bioresour. Technol., 101(6), 1752-1755. (2010).
- S. Babel, T. A. Kumiawan, J. Hazrad. Mater. 97, 219-243. (2003).
- C. C. Liu, M. Kuang-Wang, & Y. S. Li, Ind. Eng. Chem. Res., 44(5), 1438-1445. (2005).
- E. S. El-Ashtoukhy, N. K. Amin, & O. Abdelwahab, Desalination, 223(1-3), 162-173. (2008)
- M. A. Barakat, Arabian J. Chem., 4(4), 361-377. (2011).
- A. Bhatnagar, & M. Sillanpää, Chem. Eng. J., 157(2-3), 277-296. (2010).
- M. R. Lasheen, N. S. Ammar, & H. S. Ibrahim, Solid State Sci., 14(2), 202-210. (2012).
- M. A. Chavan, & S. Mane, Int. J. Sci. Res.(IJSR), 4, 3076-3080. (2015).
- F. A. Pavan, E. C. Lima, S. L. Dias, & A. C. Mazzocato, J. Hazard. Mater., 150(3), 703-712. (2008).
- F. A. Pavan, I. S. Lima, E. C. Lima, C. Airoldi, & Y. Gushikem, J. Hazard. Mater., 137(1), 527- 533. (2006).
- J. R. Memon, S. Q. Memon, M. I. Bhanger, G. Z. Memon, A. El-Turki, & G. C. Allen, Colloids Surf., B, 66(2), 260-265. (2008).
- M. Horgnies, E. Darque-Ceretti, H. Fezai, & E. Felder, Int. J. Adhes. Adhes., 31(4), 238-247. (2011).
- A. I. Osman, Renewable Energy, 146, 484-496. (2020).
- M. H. Ali, & A. M. Abdel-Satar, IJRDO-Journal of Applied Science, 3(3), 13-30. (2017).
- Z. Xuan, Y. Tang, X. Li, Y. Liu, & F. Luo, Biochem. Eng. J., 31(2), 160-164. (2006).
- F. A. Pavan, I. S. Lima, E. C. Lima, C. Airoldi, & Y. Gushikem, J. Hazard. Mater., 137(1), 527-533. (2006).
- S. Khan, A. Farooqi, M. I. Danish, & A. Zeb, IJRRAS, 16(2), 297-306. (2013).
- X. Li, Y. Tang, X. Cao, D. Lu, F. Luo, & W. Shao, Colloids Surf., A, 317(1-3), 512-521. (2008).
- S. Liang, X. Y. Guo, N. C. Feng, & Q. H. Tian, Trans. Nonferrous Met. Soc. China, 20, s187-s191. (2010).
- Z. N. Garba, N. I. Ugbaga, & A. K. Abdullahi, Beni-Suef University Journal of Basic and Applied Sciences, 5(2), 170-179. (2016).
- L. Giraldo, & J. C. Moreno-Piraján, Journal of Chemistry, 9, 938-948. (2012).
- N. Gaur, A. Kukreja, M. Yadav, & A. Tiwari, Appl. Water Sci., 8, 1-12. (2018).
- M. Horsfall Jr, A. A. Abia, & A. I. Spiff, Bioresour. Technol., 97(2), 283-291. (2006).
- M. B. Desta, J. Thermodyn., 2013. (2013).
- M. H. Karimi Darvanjooghi, S. M. Davoodi, A. Y. Dursun, M. R. Ehsani, I. Karimpour, & E. Ameri, Adsorpt. Sci. Technol., 36(3-4), 1112-1143. (2018).
- D. Schwantes, A. C. Gonçalves, G. F. Coelho, M. A. Campagnolo, D. C. Dragunski, C. R. T. Tarley, & E. A. V. Leismann, Journal of chemistry, 2016. (2016).
How to Cite this paper?
APA-7 Style
Khan,
A., Saleem,
A. (2024). Novel Synthesis of Bionanomaterials by Conversion of Potato Peels and Adsorption Studies of Ni on Prepared Surface . Pakistan Journal of Chemistry, 14(1-2), 8-17. https://doi.org/10.15228/2024.v14.i1-2.p02
ACS Style
Khan,
A.; Saleem,
A. Novel Synthesis of Bionanomaterials by Conversion of Potato Peels and Adsorption Studies of Ni on Prepared Surface . Pak. J. Chem. 2024, 14, 8-17. https://doi.org/10.15228/2024.v14.i1-2.p02
AMA Style
Khan
A, Saleem
A. Novel Synthesis of Bionanomaterials by Conversion of Potato Peels and Adsorption Studies of Ni on Prepared Surface . Pakistan Journal of Chemistry. 2024; 14(1-2): 8-17. https://doi.org/10.15228/2024.v14.i1-2.p02
Chicago/Turabian Style
Khan, A., and A. Saleem.
2024. "Novel Synthesis of Bionanomaterials by Conversion of Potato Peels and Adsorption Studies of Ni on Prepared Surface " Pakistan Journal of Chemistry 14, no. 1-2: 8-17. https://doi.org/10.15228/2024.v14.i1-2.p02

This work is licensed under a Creative Commons Attribution 4.0 International License.